Illustration Podcasts

Illustration Podcasts

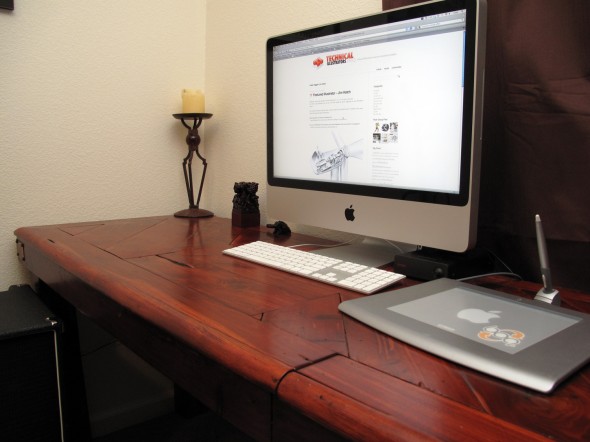
Sometimes freelancing can be like solitary confinement. Big projects, tight deadlines, (and if you’re in the Pacific Northwest, terrible weather) can all keep you locked up in the home studio. To ward off cabin fever I like to listen to a small selection of podcasts, some illustration-related, some business-related and others general interest to stay current with the rest of the world.

Sadly, I haven’t found a technical illustration podcast, but here’s my playlist:

Illustration Related:

Escape From Illustration Island: The Podcast
In-depth interviews with illustrators, artists’ representatives and art directors. Companion to Escape From Illustration Island, a resource portal and illustration community.

Big Illustration Party Time
A conversational podcast about the ins and outs of freelance illustration and cartooning.

Hawk and Squirrel
A brand new podcast searching for its voice. As manic and entertaining as its hosts (and friends of mine), Chad Covino, Juan Solon and Nimit Malavia.

Freelance and Business Related:

Freelance Radio
Official podcast of FreelanceSwitch.com covering work and life issues of freelancers.

General Interest:

The Monocle Weekly
A mix of discussions, interviews and field reports on world events and culture.

Stuff You Should Know
Official podcast of HowStuffWorks.com, explains how everyday things and not-so-everyday things work.

Have any podcasts to recommend, illustration-related or otherwise? Let us know in the comments!

The Future of Technical Illustration

Wired Magazine on iPad

For those of us who work with publishers of magazines, newspapers and books, the past few years have been trepidatious. The future of the printed page looks uncertain. There’s much speculation that this business model or that device will save the industry. And as much as we techies may fall in love with each new gadget, they have been looked at as a threat, or at least an unknown variable in our careers.

But through all this, I’ve taken comfort in two facts. First, that we live in a visual society. For this reason, the pixel pushers, the vector tweakers, the pen sketchers, and more importantly the visual thinkers will always be in demand. Secondly, the environment around us grows more complex every day. We specialize in distilling complexity into more comprehensive, communicative forms.

I feel our skillset will remain relevant and in demand, but it is crucial to stay informed about prevailing technologies and mediums, and to constantly update our workflows to be able to deliver our product in whatever packaging consumers demand.

Threats or opportunities? What are your thoughts?

Chart Junk Beneficial?

Snap decision: Which chart is better?

Snap decision: Which chart is better?

The chart on the right is traditionally thought of as better: clearer, less distracting, more honest and true to the data. However, recent research suggests the chart on the left better communicates the topic, the categories and values, and the overall trend of the data—and is more easily recalled:

Guidelines for designing information charts often state that the presentation should reduce chart junk – visual embellishments that are not essential to understanding the data. In contrast, some popular chart designers wrap the presented data in detailed and elaborate imagery, raising the questions of whether this imagery is really as detrimental to understanding as has been proposed, and whether the visual embellishment may have other benefits. To investigate these issues, we conducted an experiment that compared embellished charts with plain ones, and measured both interpretation accuracy and long-term recall. We found that people’s accuracy in describing the embellished charts was no worse than for plain charts, and that their recall after a two-to-three-week gap was significantly better.

Junk chart vs Minimalist chart

This research challenges popular assumptions among data visualization purists. But it also presents opportunities for us. Technical illustration is all about synthesizing information, facts, data with imagery to give context. This research is evidence that this synthesis is more effective, more appealing and more memorable than data alone.

Radiation Infographic by Davvi from our Flickr Pool

Radiation Infographic by Davvi from our Flickr Pool

Full report: Useful Junk? [via Information Aesthetics, Eager Eyes]

Malofiej 18 – Award Winning Infographics

Presente, Diario del Sureste (México)

Presente, Diario del Sureste (México)

Malofiej is the Society for News Design‘s annual infographics competition. At Malofiej 18 last week, a jury of 13 international graphics editors and art directors awarded medals in a myriad of categories including Breaking News, One-Column and Interactive.

More images and links as well as a full list of award winners at Infographic News

Let’s see those workspaces

I love to see where people work, what kind of equipment they are using, desk, chairs, how you set up your space etc.

Here’s where I work at home. I’m really pleased with the desk. My brother in-law bought an antique mahagony trunk for 20 bucks and we chopped it up and turned it into a desk. I’m still surprised how well that turned out.

IMG_3323

Read More